Python通过matplotlib动态绘图实现中美GDP历年对比趋势动图

随着中国的各种实力的提高,经常在各种媒体上看到中国与各个国家历年的各种指标数据的对比,为了更清楚的展示历年的发展趋势,有的还做成了动图,看到中国各种指标数据的近年的不断逆袭,心中的自豪感油然而生。今天通过Python来实现matplotlib的动态绘图,将中美两国近年的GDP做个对比,展示中国GPD对美国的追赶态势,相信不久的将来中国的GDP数据将稳超美国。

效果如下:
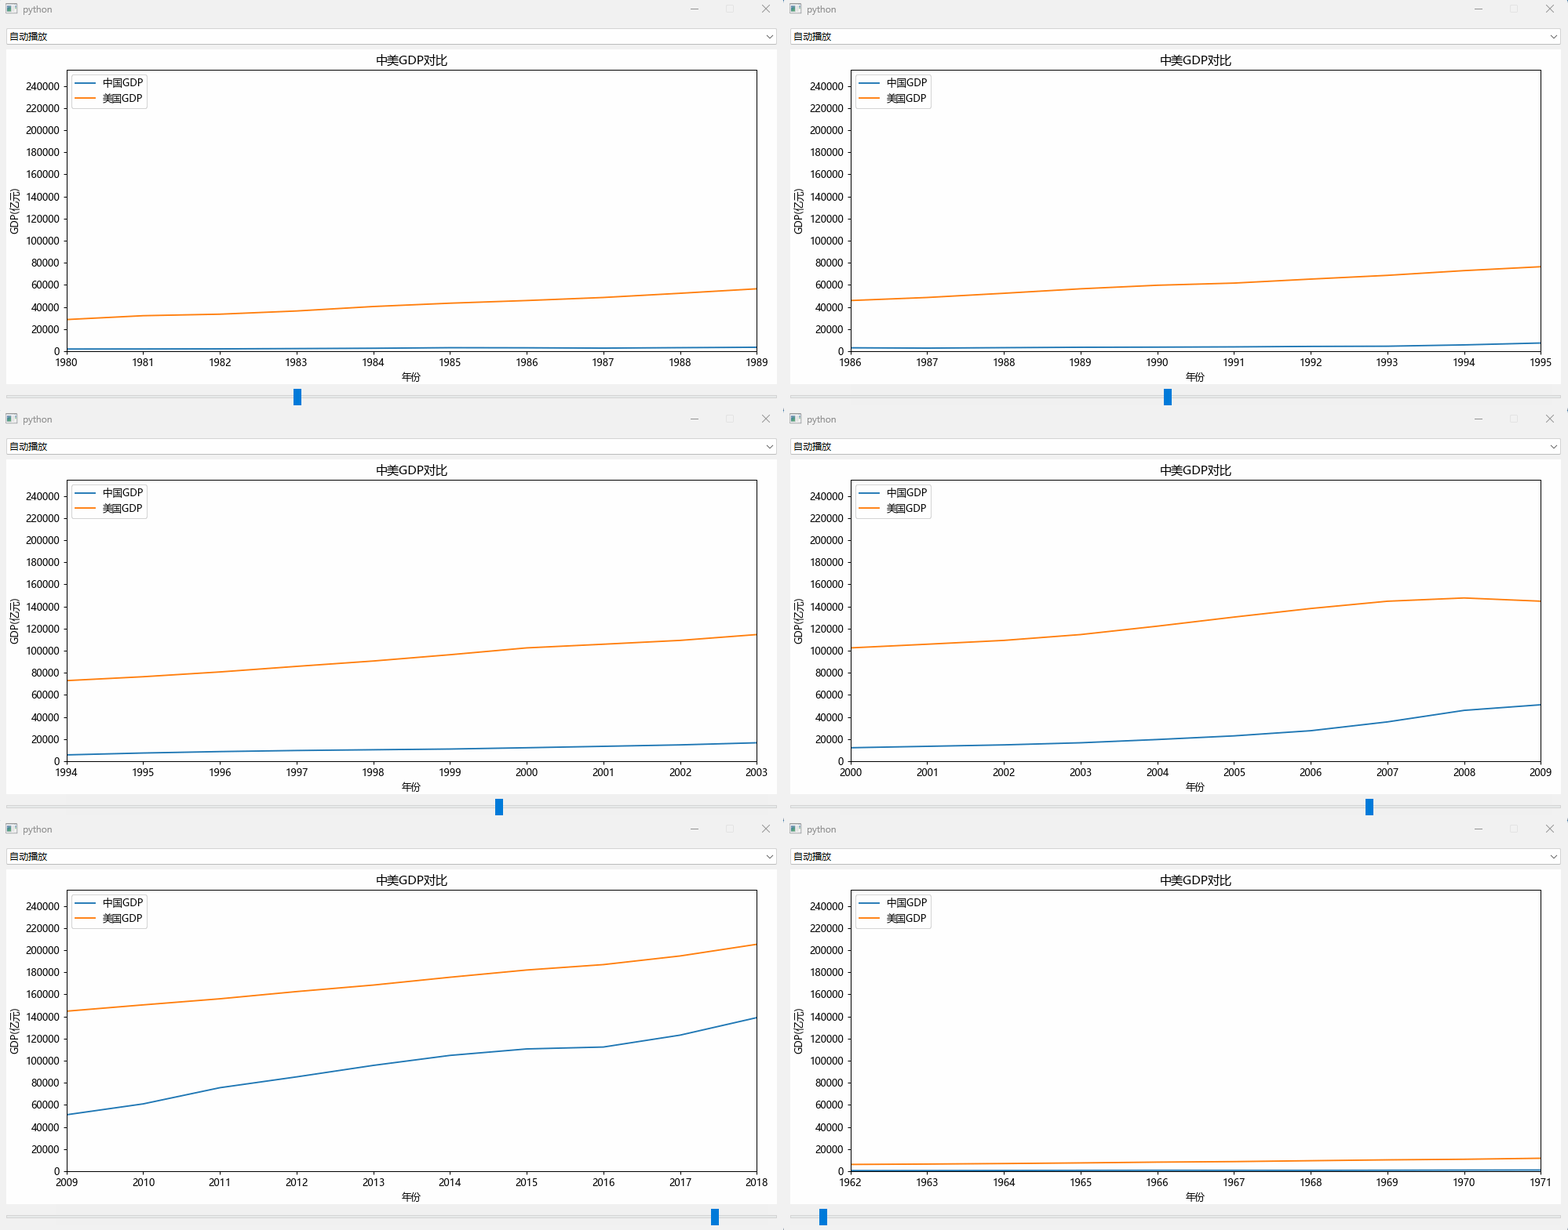
中美GDP历年对比趋势动图

实现上面的动态绘图效果,综合用到了pandas的数据采集、数据整理、matplotlib绘图、坐标轴及数据的动态定义、定时器等知识。最终通过Python的GUI库PySide进行展示形成一个GUI的可执行程序。

一、数据采集和准备

中美历年的GDP数据通过百度在网上一搜一大把。我是从https://www.kylc.com/stats/global/yearly_per_country/g_gdp/chn-usa.html 找到的数据。将数据整理成EXCEL保存至data\中国VS美国.xlsx。
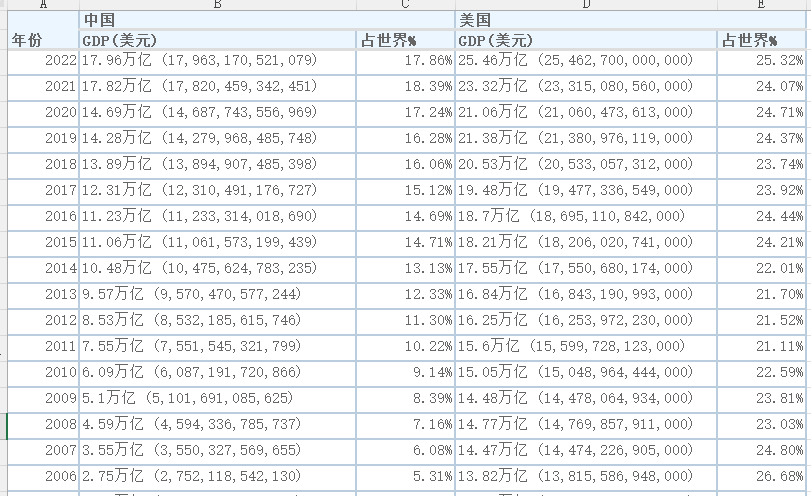
中国VS美国GDP数据集

有从1966年至2022年的中美GDP的数据。
首先对这些数据进行整理,因为获取的GDP数据是字符串类型如17.96万亿 (17,963,170,521,079),我们需要将GDP的数据从文本中提取出来,也就是取括号中的数据。
这里通过正则表达式将括号中的GDP数据提取出来,并转换为亿元为单位。

1
2
3
4
5
6
7
8
9
10
11
12
13
14
15
16
17
import re
import pandas as pd
import locale
import matplotlib.pyplot as plt

pattern = re.compile('\((\S*)\)')

def getgdpvalue(gdpstr):
re_obj=pattern.search(gdpstr)
gdp_value=locale.atof(re_obj.group(1))/100000000
return gdp_value

df_data = pd.read_excel('data\中国VS美国.xlsx')
df_data = df_data.loc[1:len(df_data)]
df_data['china_gdp_value'] = df_data['中国'].map(getgdpvalue)
df_data['us_gdp_value'] = df_data['美国'].map(getgdpvalue)
df_data = df_data.sort_values('年份')

有了数据以后就可以通过数据绘图了。

二、matplotlib绘图

先通过matplotlib绘图看看数据的效果。

1
2
3
4
5
6
7
8
import matplotlib.pyplot as plt
plt.figure()
plt.plot(df_data['年份'],df_data['china_gdp_value'])
plt.plot(df_data['年份'],df_data['us_gdp_value'])
plt.title('中美GDP对比')
plt.xlabel('年份')
plt.ylim('GDP(亿)')
plt.show()

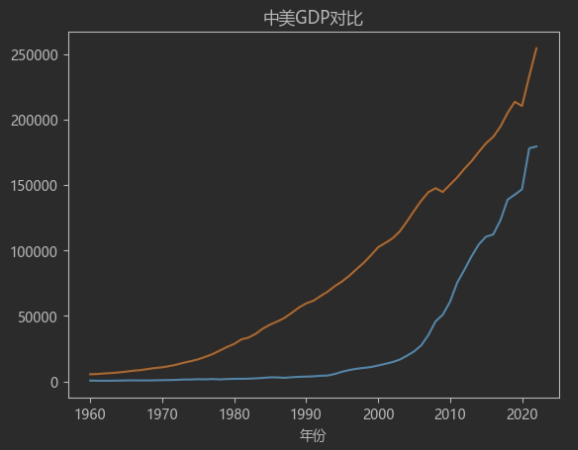
中美GDP对比趋势

可以看到中国的GDP数据在1960年至1990年都是比较平稳的,到了1990年后中国开始了爆发式的追赶模式。
我们要将这种趋势通过动态的方式展示出来。

三、数据展示与动态更新

首先通过QMainWindw定义QWidget组件,在QWidget中加入FigureCanvasQTAgg组件通过canvas载入matplotlib绘图。

1
2
3
4
5
6
7
8
9
10
11
12
13
14
15
16
17
18
19
20
21
22
23
24
25
26
27
28
29
30
31
32
33
34
35
36
37
38
39
40
41
42
43
44
45
46
47
48
49
50
51
52
class ApplicationWindow(QMainWindow):

def __init__(self, parent=None,org_data=None):
QMainWindow.__init__(self, parent)
self.axes = None
self.axis_china=None
self.axis_us=None
self.datacount=10
self.org_data = org_data
self.auto_offset = 0
# Central widget
self._main = QWidget()
self.setCentralWidget(self._main)
# Figure
self.canvas = FigureCanvasQTAgg(figure)
if len(self.org_data) > 0:
show_data = self.org_data[0:self.datacount]
self.axes = self.canvas.figure.subplots()
self.axes.set_title('中美GDP对比')
self.axis_china = self.axes.plot(show_data['年份'], show_data['china_gdp_value'], label='中国GDP')
self.axis_us = self.axes.plot(show_data['年份'], show_data['us_gdp_value'], label='美国GDP')
y_max = max(self.org_data['us_gdp_value'].max(), self.org_data['china_gdp_value'].max())
self.axes.set_ylabel('GDP(亿元)')
self.axes.set_xlabel('年份')
self.axes.set_ylim(0, y_max)
self.axes.set_xlim(show_data['年份'].min(), show_data['年份'].max())
self.axes.legend(loc="upper left")
self.axes.yaxis.set_major_locator(mticker.MultipleLocator(20000))
self.axes.xaxis.set_major_locator(mticker.MultipleLocator(1))
figure.tight_layout() # 自动调整子图参数,使之填充整个图像区域
# 下拉框,选择模式 # ComboBox (combo_type)
self.combo_type = QComboBox()
self.combo_type.addItems(['自动播放', '手动播放'])
# Sliders
min_value = 0
self.max_value = len(self.org_data)-cur_data_len
self.slider_update = QSlider(minimum=min_value, maximum=self.max_value, orientation=Qt.Horizontal) # 滑动条
layout1 = QHBoxLayout()
layout1.addWidget(self.combo_type)
# layout
layout2 = QVBoxLayout()
layout2.addWidget(self.canvas, 88)
layout2.addWidget(self.slider_update)
# Main layout
layout = QVBoxLayout(self._main)
layout.addLayout(layout1)
layout.addLayout(layout2, 100)
self.canvas.draw()
# Signal and Slots connections
self.combo_type.currentTextChanged.connect(self.selecttype)
self.slider_update.valueChanged.connect(self.update_frequency)
self.autoslider()

一种方式是通过QSlider组件,通过手动拉slider组件来实现数据的变化,一种通过QTimer组件自动让数据变化。

1、QSlider组件,手动方式实现动态绘图

1
2
3
4
5
6
7
8
9
10
11
12
13
@Slot()
def update_frequency(self, new_val):
# 偏移量每次偏移1
f = int(new_val)
offset = f + cur_data_len # 偏移刻度
show_data = self.org_data[f: offset]
x = show_data['年份']
y_china = show_data['china_gdp_value']
y_us = show_data['us_gdp_value']
self.axes.set_xlim(x.min(), x.max())
self.axis_china[0].set_data(x, y_china)
self.axis_us[0].set_data(x, y_us)
self.canvas.draw()

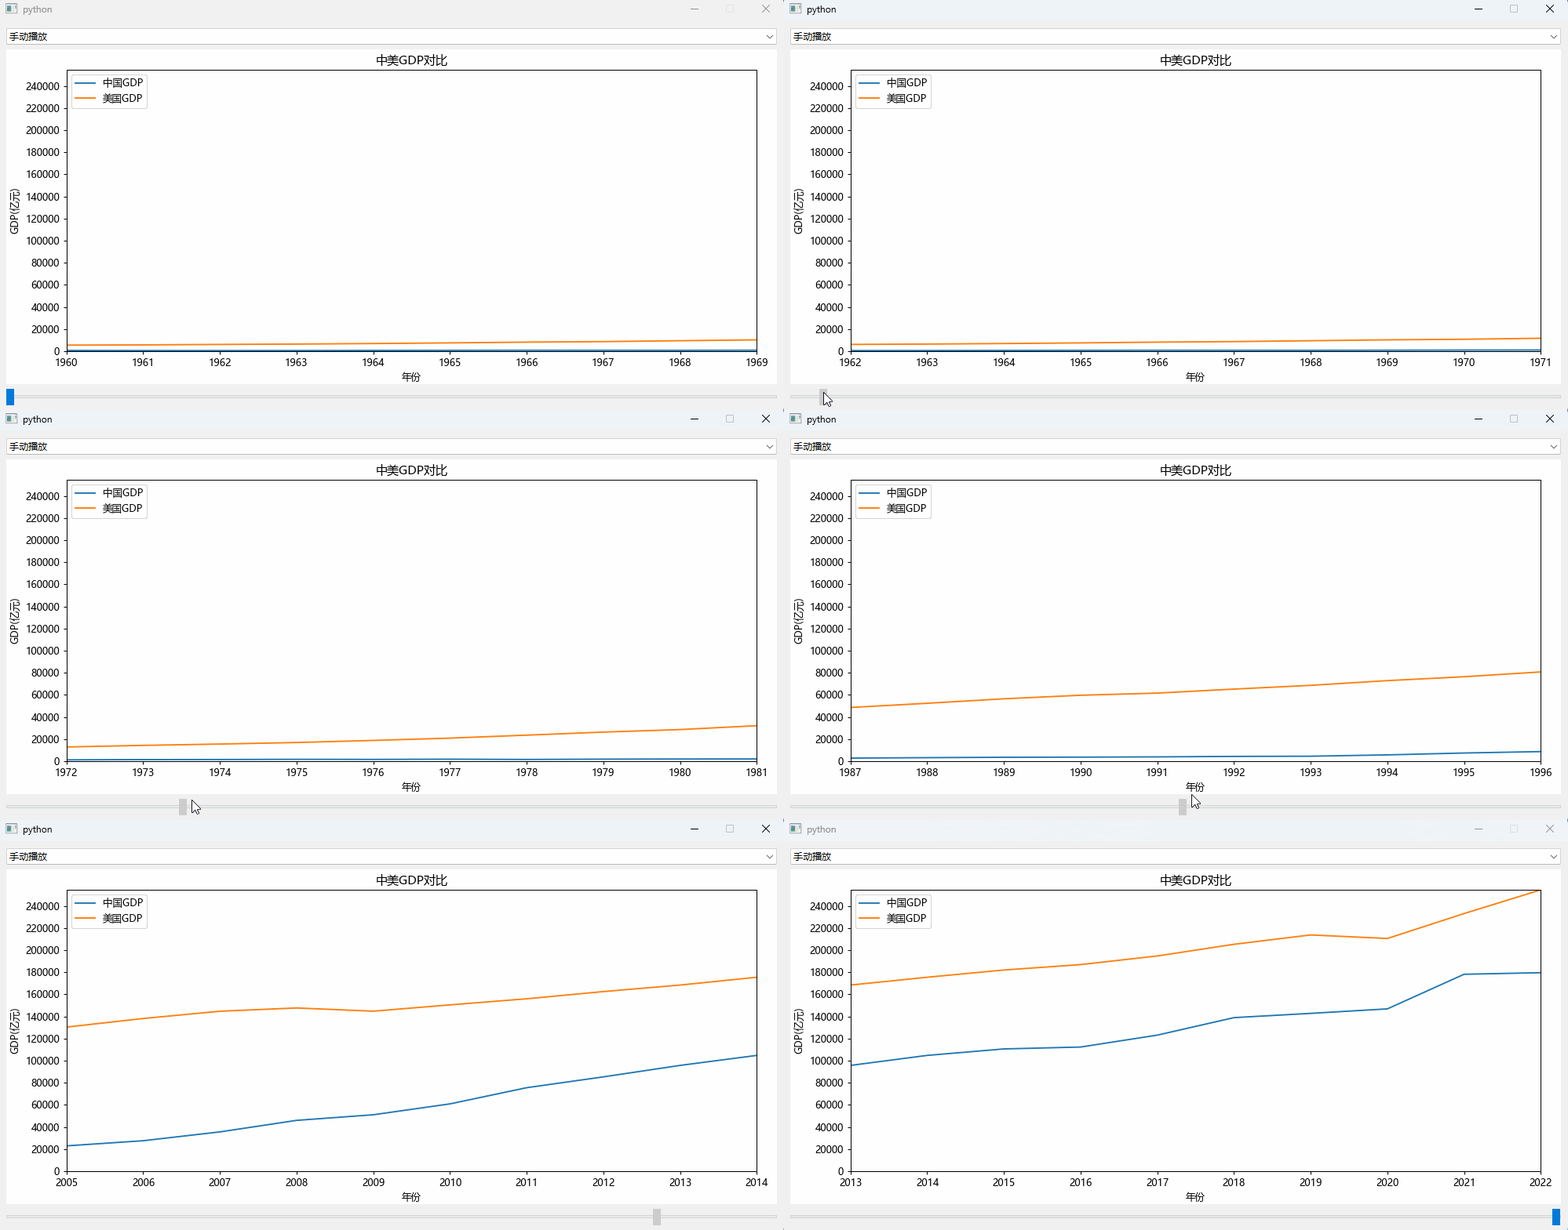
手动拉slider组件来实现数据的变化效果:
手动数据变化

2、QTimer组件,自动动态绘图

1
2
3
4
5
6
7
8
9
10
11
12
13
14
15
    self.autoslider()

def autoslider(self):
self.timer = QTimer()
self.timer.setInterval(100) # 100毫秒更新一次数据
self.timer.timeout.connect(self.autoupdate) #自动更新数据,每次更新偏移量加1,也就是跳一年的数据
self.timer.start()

def autoupdate(self):
self.update_frequency(self.auto_offset)
self.slider_update.setSliderPosition(self.auto_offset)
if self.auto_offset < self.max_value:
self.auto_offset = self.auto_offset+1
else:
self.auto_offset = 0

效果如文章最前面所示。

四、完整代码

1
2
3
4
5
6
7
8
9
10
11
12
13
14
15
16
17
18
19
20
21
22
23
24
25
26
27
28
29
30
31
32
33
34
35
36
37
38
39
40
41
42
43
44
45
46
47
48
49
50
51
52
53
54
55
56
57
58
59
60
61
62
63
64
65
66
67
68
69
70
71
72
73
74
75
76
77
78
79
80
81
82
83
84
85
86
87
88
89
90
91
92
93
94
95
96
97
98
99
100
101
102
103
104
105
106
107
108
109
110
111
112
113
114
115
116
117
118
119
120
121
122
123
124
import re
import sys
import pandas as pd
import locale
import matplotlib.ticker as mticker
from PySide6.QtCore import Qt, Slot, QTimer
from PySide6.QtWidgets import QMainWindow, QApplication, QVBoxLayout, QHBoxLayout, QWidget, QSlider, QComboBox
from matplotlib.backends.backend_qtagg import FigureCanvasQTAgg
from matplotlib.figure import Figure

figure = Figure(figsize=(12, 6), dpi=90)

global cur_data_len, cur_major_locator
cur_data_len = 10 # 当前显示的数据量(显示10年的数据)
cur_major_locator = 10 # 当前刻度的定位器(主刻度)

pattern = re.compile('\((\S*)\)')

def getgdpvalue(gdpstr):
re_obj=pattern.search(gdpstr)
gdp_value=locale.atof(re_obj.group(1))/100000000
return gdp_value

class ApplicationWindow(QMainWindow):

def __init__(self, parent=None,org_data=None):
QMainWindow.__init__(self, parent)
self.axes = None
self.axis_china=None
self.axis_us=None
self.datacount=10
self.org_data = org_data
self.auto_offset = 0
# Central widget
self._main = QWidget()
self.setCentralWidget(self._main)
# Figure
self.canvas = FigureCanvasQTAgg(figure)
if len(self.org_data) > 0:
show_data = self.org_data[0:self.datacount]
self.axes = self.canvas.figure.subplots()
self.axes.set_title('中美GDP对比')
self.axis_china = self.axes.plot(show_data['年份'], show_data['china_gdp_value'], label='中国GDP')
self.axis_us = self.axes.plot(show_data['年份'], show_data['us_gdp_value'], label='美国GDP')
y_max = max(self.org_data['us_gdp_value'].max(), self.org_data['china_gdp_value'].max())
self.axes.set_ylabel('GDP(亿元)')
self.axes.set_xlabel('年份')
self.axes.set_ylim(0, y_max)
self.axes.set_xlim(show_data['年份'].min(), show_data['年份'].max())
self.axes.legend(loc="upper left")
self.axes.yaxis.set_major_locator(mticker.MultipleLocator(20000))
self.axes.xaxis.set_major_locator(mticker.MultipleLocator(1))
figure.tight_layout() # 自动调整子图参数,使之填充整个图像区域
# 下拉框,选择模式 # ComboBox (combo_type)
self.combo_type = QComboBox()
self.combo_type.addItems(['自动播放', '手动播放'])
# Sliders
min_value = 0
self.max_value = len(self.org_data)-cur_data_len
self.slider_update = QSlider(minimum=min_value, maximum=self.max_value, orientation=Qt.Horizontal) # 滑动条
layout1 = QHBoxLayout()
layout1.addWidget(self.combo_type)
# layout
layout2 = QVBoxLayout()
layout2.addWidget(self.canvas, 88)
layout2.addWidget(self.slider_update)
# Main layout
layout = QVBoxLayout(self._main)
layout.addLayout(layout1)
layout.addLayout(layout2, 100)
self.canvas.draw()
# Signal and Slots connections
self.combo_type.currentTextChanged.connect(self.selecttype)
self.slider_update.valueChanged.connect(self.update_frequency)
self.autoslider()

def autoslider(self):
self.timer = QTimer()
self.timer.setInterval(100) # 100毫秒更新一次数据
self.timer.timeout.connect(self.autoupdate) #自动更新数据,每次更新偏移量加1,也就是跳一年的数据
self.timer.start()

def autoupdate(self):
self.update_frequency(self.auto_offset)
self.slider_update.setSliderPosition(self.auto_offset)
if self.auto_offset < self.max_value:
self.auto_offset = self.auto_offset+1
else:
self.auto_offset = 0

@Slot()
def selecttype(self, text):
if '自动播放' == text:
self.autoslider()
elif '手动播放' == text:
self.timer.stop()

@Slot()
def update_frequency(self, new_val):
# 偏移量每次偏移1
f = int(new_val)
offset = f + cur_data_len # 偏移刻度
show_data = self.org_data[f: offset]
x = show_data['年份']
y_china = show_data['china_gdp_value']
y_us = show_data['us_gdp_value']
self.axes.set_xlim(x.min(), x.max())
self.axis_china[0].set_data(x, y_china)
self.axis_us[0].set_data(x, y_us)
self.canvas.draw()


if __name__ == "__main__":
app = QApplication(sys.argv)
locale.setlocale(locale.LC_ALL, 'en_US.UTF-8')
df_data = pd.read_excel('data\中国VS美国.xlsx')
df_data = df_data.loc[1:len(df_data)]
df_data['china_gdp_value'] = df_data['中国'].map(getgdpvalue)
df_data['us_gdp_value'] = df_data['美国'].map(getgdpvalue)
df_data = df_data.sort_values('年份')
w = ApplicationWindow(org_data=df_data)
w.setFixedSize(1000, 500)
w.show()
app.exec()

六、总结

Python实现matplotlib动态绘图,是非常简单和容易的,其实关键还是在数据的组织,也就是要准备好要绘图的坐标轴的x的数据和y的数据,通过set_data(x,y)来动态更新数据,要注意的是变化的数据后X轴或Y轴的显示要变化,这里可以通过轴的set_xlim()或set_ylim()方法来动态设置,刻度也可通过set_major_locator()来指定。

数据集见 https://xiejava1018.github.io/xiejavaimagesrc/images/2023/20230827/中国VS美国.xlsx


作者博客:http://xiejava.ishareread.com/


“fullbug”微信公众号

关注微信公众号,一起学习、成长!

0%